top of page

Practical Excel & Power BI Learning Resources
Explore clear tutorials, practical examples and downloadable files designed around real business questions.
Search


Turn Raw Sales Data into an Interactive Excel Dashboard Using PivotTables
In this tutorial, I’ll show you how to build an interactive Excel sales dashboard using PivotTables, PivotCharts, slicers, and timelines. We’ll start from raw sales data, review the dataset, plan what the dashboard should show, create the supporting PivotTables, and then turn everything into a clean dashboard. You can download the practice file below and follow along with the video. Download the practice file: Watch the full tutorial: Dashboard scenario In this example, we ar

TWX Margerate
Jul 244 min read
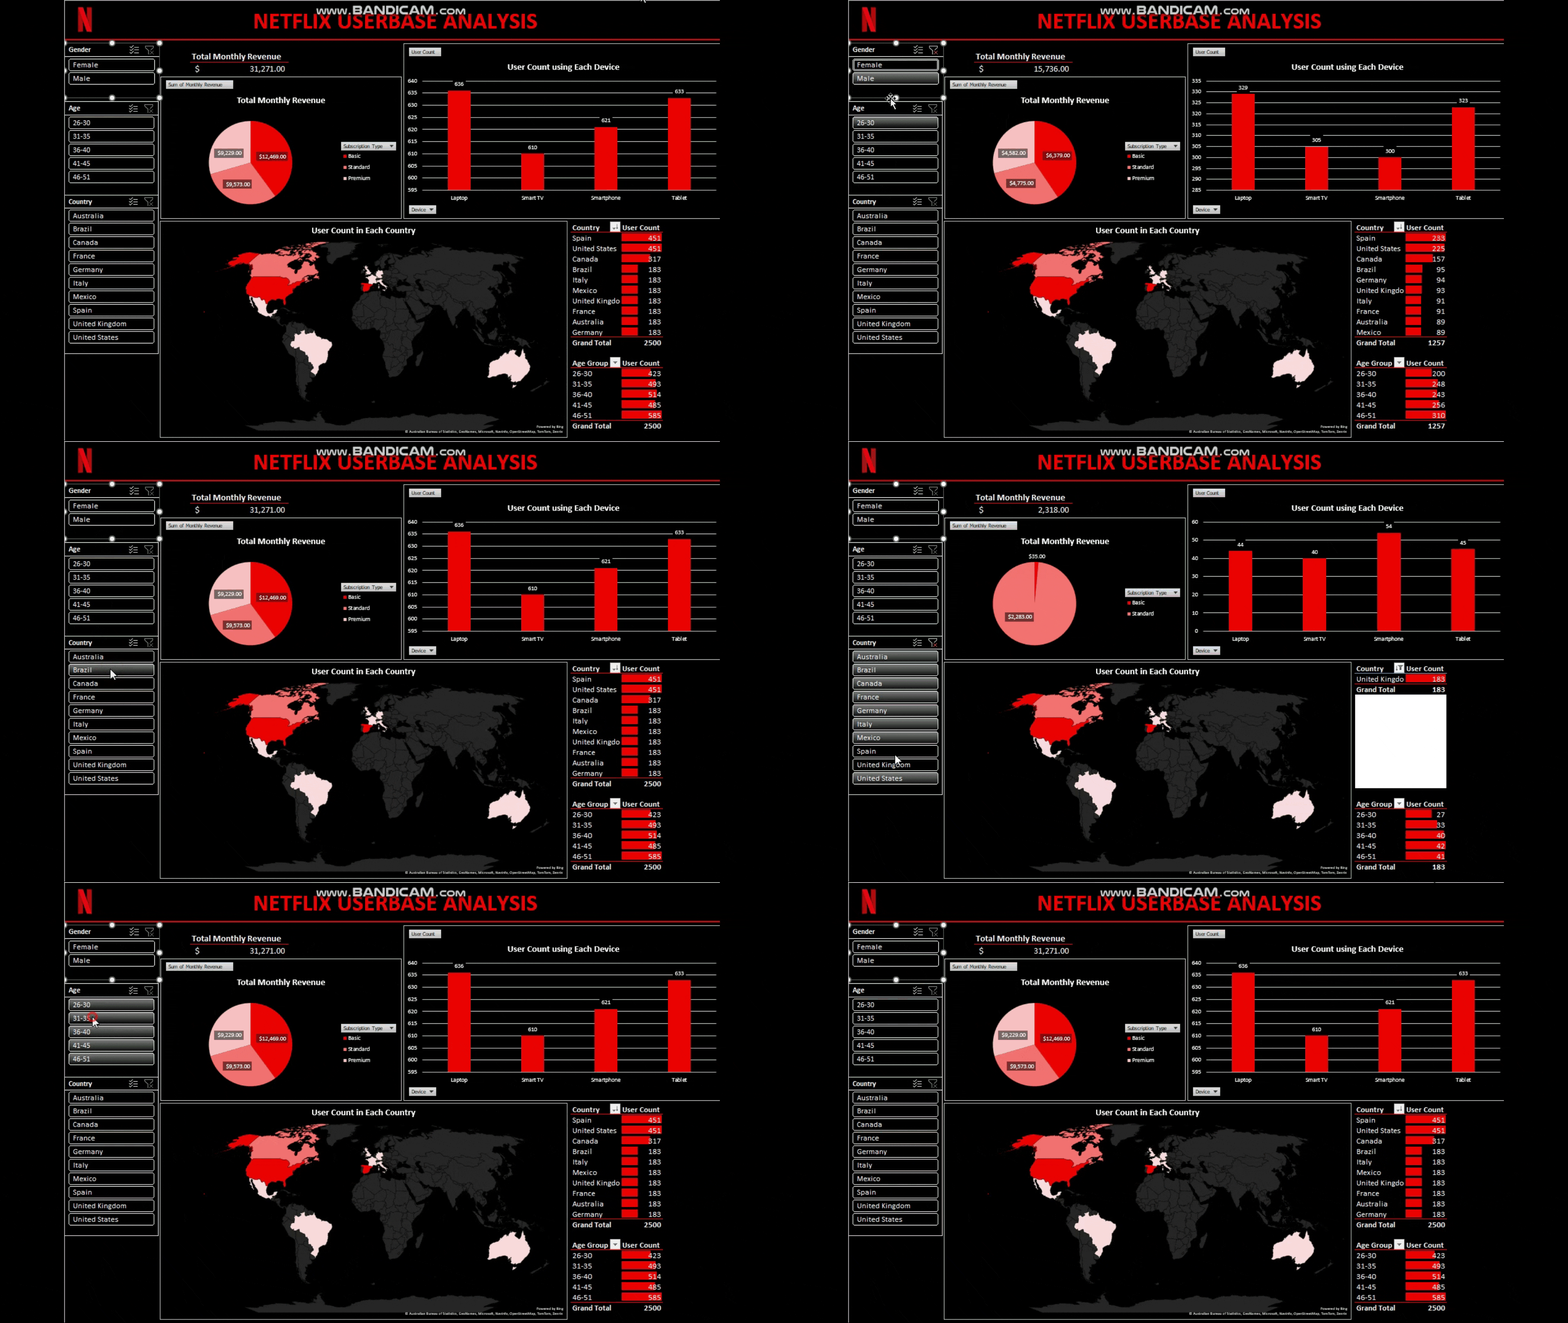
Netflix Userbase Excel Dashboard
This project is to create a dashboard in Excel to analyse Netflix Userbase. In this blog post, I'll show you how I did it. This is the dashboard that I have created in Excel as shown below: The dataset I used is from Kaggle: https://www.kaggle.com/datasets/arnavsmayan/netflix-userbase-dataset It's important to read the dataset description to understand what's the data is about so that it will be easier when cleaning and analysing the dataset. Step 1 : Data Cleaning When clean
TWX Margerate
Jul 13, 20234 min read
bottom of page